

This article was updated more than 6 months ago. Some information may be outdated.
StatsCan released its employment data last week. Usually, these updates have broader impacts on temporary residents in Canada – but this update was a little different.
The most recent unemployment rate data from StatsCan falls on a scheduled update period for Employment and Social Development Canada (ESDC). ESDC has now updated its processing refusal rates for Labour Market Impact Assessments submitted from January 9, 2026 to April 9, 2026 – and it’s generally good news.
This is surprising, since Canada’s unemployment rate ticked up to 6.8% this period. However, the LMIA processing freeze focuses on local unemployment rates. Those local unemployment rates actually dropped across a number of key regions in Canada, which means employers in those regions can once again submit low-wage LMIAs for processing!
This post covers everything you need to know about which regions are now eligible for low-wage LMIA processing, where employers still can’t have low-wage LMIAs processed (no matter how much they want to hire you!), and what this means for temporary workers in Canada. Plus, we provide a bit more background on this policy – in case you missed it.
Key Takeaways
- A 2024 policy links Canada’s unemployment rates to LMIA processing. Every three months, ESDC updates the unemployment rates it uses to decide if it will process certain low-wage LMIAs.
- ESDC will now process LMIAs for 8 new regions which were previously subject to an LMIA-freeze, thanks to the recently updated figures.
- These changes remain in effect until April 9, 2026. ESDC will update its LMIA processing unemployment data from April 10. If you want to stay in the loop about updates to these rates, join our community. We regularly share key immigration updates, plus settlement resources to help you succeed in Canada.

Where The LMIA Freeze is Over in Canada
After the most recent unemployment rates update, the LMIA freeze ended in 8 regions! This means the EDSC will now process low-wage LMIAs submitted in these regions. As a result, eligible workers in low-wage roles in these areas may receive their LMIA and temporary work permit. All other ‘usual’ processing requirements still apply, including the temporary foreign worker cap limits. See more on eligibility on our dedicated LMIA page.
These are the regions where unemployment dropped below 6% in the newest period, and where the LMIA freeze is now over (until at least the April 10, 2026 update):
- Halifax, Nova Scotia (6.1 → 5.2)
- Moncton, New Brunswick (7.3 → 5.5)
- Saint John, New Brunswick (7.3 → 5.8)
- Fredericton, New Brunswick (6.7 → 5.2)
- Montréal, Quebec (6.7 → 5.5)
- Kingston, Ontario (6.6 → 5.6)
- Winnipeg, Manitoba (7.3 → 5.7)
- Vancouver, British Columbia (6.8 → 5.9).
Regions Where Workers Can Get an LMIA in Canada, If Eligible
The next update is due on April 10, 2026, which means that the eligible regions may change on that date. It’s important to bear this in mind when you’re submitting an LMIA for processing – and try to plan to have your employer submit the LMIA by this time if your region is currently eligible.
The regions where LMIAs are eligible for processing from January 9 to April 9 2026 are:
- Halifax, Nova Scotia — 5.2%
- Moncton, New Brunswick — 5.5%
- Saint John, New Brunswick — 5.8%
- Fredericton, New Brunswick — 5.2%
- Saguenay, Quebec — 4.3%
- Québec, Quebec — 2.9%
- Sherbrooke, Quebec — 4.8%
- Trois-Rivières, Quebec — 3.9%
- Drummondville, Quebec — 5.6%
- Montréal, Quebec — 5.5%
- Kingston, Ontario — 5.6%
- Peterborough, Ontario — 5.3%
- Thunder Bay, Ontario — 4.2%
- Winnipeg, Manitoba — 5.7%
- Saskatoon, Saskatchewan — 5.8%
- Vancouver, British Columbia — 5.9%
- Victoria, British Columbia — 3.7%.
Note that this list only considers unemployment in ‘CMAs’ in Canada – that means regions where the core population is 100,000 or higher. Smaller regions with fewer than 100,000 people are not covered by this policy, so employers in these areas can generally apply for a low-wage LMIA, if eligible.
Where Is the LMIA Freeze Still in Place?
These are the regions where the LMIA freeze is still in place. Employers in these regions will not have their LMIAs processed for low-wage roles.
- St. John’s, Newfoundland and Labrador — 7.1%
- Ottawa–Gatineau (Ontario/Quebec) — 6.8%
- Belleville–Quinte West, Ontario — 10.6%
- Oshawa, Ontario — 8.0%
- Toronto, Ontario — 7.5%
- Hamilton, Ontario — 6.4%
- St. Catharines–Niagara, Ontario — 6.5%
- Kitchener–Cambridge–Waterloo, Ontario — 8.1%
- Brantford, Ontario — 8.5%
- Guelph, Ontario — 7.4%
- London, Ontario — 7.3%
- Windsor, Ontario — 7.1%
- Barrie, Ontario — 8.7%
- Greater Sudbury, Ontario — 6.0%
- Regina, Saskatchewan — 6.3%
- Lethbridge, Alberta — 7.2%
- Calgary, Alberta — 6.3%
- Red Deer, Alberta — 8.9%
- Edmonton, Alberta — 6.9%
- Kelowna, British Columbia — 8.5%
- Kamloops, British Columbia — 6.6%
- Chilliwack, British Columbia — 7.3%
- Abbotsford–Mission, British Columbia — 6.4%
- Nanaimo, British Columbia — 6.3%
When we look at this list, it’s notable that many CMAs remain above 6% in the new January–April 2026 window, and some are still quite elevated.
- Southern Ontario remains a major hotspot. Toronto (7.5) and Oshawa (8.0) are still high. The unemployment rate in Windsor dropped sharply from 11.3 to 7.1, but it remains well above the 6% line.
- Belleville–Quinte West jumped to 10.6 in the newest period (from 6.6).
- Prairie and Alberta CMAs remain mixed but generally elevated. Edmonton (6.9), Calgary (6.3), and Red Deer (8.9) remain above 6%, while Winnipeg improves below 6%.
- British Columbia shows a split between the coast and some interior markets. Vancouver fell below 6%, which is very encouraging and Victoria remains low at 3.7%. However, other BC CMAs are still above 6% (Kelowna 8.5; Kamloops 6.6; Chilliwack 7.3; Abbotsford–Mission 6.4; Nanaimo 6.3).
Background: The LMIA Hiring Freeze on Certain Regions
In case you missed it, there has been a processing freeze on LMIAs for low-wage roles in regions with a local unemployment rate of 6% or higher since 2024.
This means that if the unemployment rate in your area is above 6% and you are working in a low-wage role, employers can’t hire you through an LMIA. It doesn’t matter how qualified you are or how much the employer wants to keep you on – ESDC will not process your LMIA.
This policy has fairly broad impacts on Canada’s temporary residents including:
- Lack of ability to apply for a renewed LMIA and temporary foreign work permit for those living in high unemployment areas and working in low-wage roles when work permits expire.
- Lack of ability to apply for an LMIA for low-wage roles for those currently in Canada hoping to extend legal status in Canada while working towards permanent residency. This impacts those on a current PGWP, IEC or other IMP program permit.
- Plus, all the consequences that come with not being able to remain working in Canada as a temporary resident – such as access to healthcare, PNP-eligibility, and more. You can read more about the broader impacts here.
Unemployment Rates for LMIA Processing Over Time
| Census metropolitan area | Unemployment rate (%) for applications submitted from April 4 to July 10, 2025 | Unemployment rate (%) for applications submitted from July 11-October 9, 2025 | Unemployment rate (%) for applications submitted from October 10, 2025 to January 8, 2026 | Unemployment rate (%) for applications submitted from January 9, 2026, to April 9, 2026 | Unemployment rate (%) for applications submitted from April 10, 2026, to July 9, 2026 | Unemployment rate (%) for applications submitted from July 10, 2026, to October 8, 2026 |
|---|---|---|---|---|---|---|
| St. John's, Newfoundland and Labrador | 7.6 | 7.2 | 6.8 | 7.1 | 7.6 | 7.3 |
| Halifax, Nova Scotia | 4.8 | 6.2 | 6.1 | 5.2 | 6.1 | 5.9 |
| Moncton, New Brunswick | 5.4 | 6.4 | 7.3 | 5.5 | 7.4 | 8.1 |
| Saint John, New Brunswick | 7.7 | 7.4 | 7.3 | 5.8 | 6.0 | 5.9 |
| Fredericton, New Brunswick | 6.9 | 6.2 | 6.7 | 5.2 | 6.5 | 5.3 |
| Saguenay, Quebec | 4.1 | 4.3 | 4.2 | 4.3 | 3.9 | 3.4 |
| Québec, Quebec | 5.1 | 4.1 | 4.6 | 2.9 | 3.3 | 4.0 |
| Sherbrooke, Quebec | 5.2 | 4.8 | 5.3 | 4.8 | 5.2 | 4.3 |
| Trois-Rivières, Quebec | 5.6 | 5.2 | 5.1 | 3.9 | 5.2 | 5.3 |
| Drummondville, Quebec | 8 | 5.6 | 4.7 | 5.6 | 7.3 | 5.7 |
| Montréal, Quebec | 6.7 | 6.9 | 6.7 | 5.5 | 6.8 | 6.8 |
| Ottawa-Gatineau, Ontario/Quebec | 5.3 | 6.4 | 7.7 | 6.8 | 6.2 | 6.7 |
| Kingston, Ontario | 7.2 | 7.2 | 6.6 | 5.6 | 6.2 | 5.3 |
| Belleville - Quinte West, Ontario | 5.6 | 7.1 | 6.6 | 10.6 | 7.9 | 6.7 |
| Peterborough, Ontario | 9.9 | 9.9 | 5.6 | 5.3 | 6.3 | 7.0 |
| Oshawa, Ontario | 8 | 9.2 | 9.5 | 8 | 7.5 | 8.5 |
| Toronto, Ontario | 8.6 | 8.9 | 9.5 | 7.5 | 7.9 | 7.3 |
| Hamilton, Ontario | 7.3 | 6.6 | 7.6 | 6.4 | 6.7 | 6.9 |
| St. Catharines-Niagara, Ontario | 7.7 | 6.4 | 7 | 6.5 | 7.2 | 5.8 |
| Kitchener-Cambridge-Waterloo, Ontario | 8.5 | 6.9 | 7.4 | 8.1 | 9.1 | 8.1 |
| Brantford, Ontario | 7.2 | 6.8 | 9.4 | 8.5 | 6.8 | 6.2 |
| Guelph, Ontario | 6.2 | 5.9 | 9.2 | 7.4 | 6.5 | 7.4 |
| London, Ontario | 5.5 | 6.9 | 7 | 7.3 | 9.3 | 7.8 |
| Windsor, Ontario | 9.3 | 11 | 11.3 | 7.1 | 8.8 | 7.9 |
| Barrie, Ontario | 7.5 | 7.3 | 7.5 | 8.7 | 8.8 | 7.9 |
| Greater Sudbury, Ontario | 5.8 | 5.4 | 7 | 6 | 6.4 | 6.2 |
| Thunder Bay, Ontario | 4.8 | 5.1 | 5.1 | 4.2 | 5.9 | 4.9 |
| Winnipeg, Manitoba | 5.9 | 5.6 | 7.3 | 5.7 | 6.0 | 5.6 |
| Regina, Saskatchewan | 5.9 | 5.3 | 6.8 | 6.3 | 6.4 | 5.9 |
| Saskatoon, Saskatchewan | 4.8 | 4.6 | 5.7 | 5.8 | 5.5 | 6.5 |
| Lethbridge, Alberta | 5.7 | 5.2 | 8.5 | 7.2 | 5.9 | 5.4 |
| Calgary, Alberta | 7.8 | 7.3 | 8 | 6.3 | 7.1 | 7.0 |
| Red Deer, Alberta | 8.4 | 5.6 | 8.7 | 8.9 | 5.9 | 7.2 |
| Edmonton, Alberta | 7.3 | 7.6 | 9 | 6.9 | 7.0 | 7.2 |
| Kelowna, British Columbia | 6.7 | 5 | 6 | 8.5 | 8.9 | 7.5 |
| Kamloops, British Columbia | 7.1 | 8.7 | 8.6 | 6.6 | 5.2 | 7.0 |
| Chilliwack, British Columbia | 5.9 | 6.3 | 7.8 | 7.3 | 5.7 | 7.9 |
| Abbotsford-Mission, British Columbia | 6.2 | 6.1 | 8.1 | 6.4 | 6.2 | 8.0 |
| Vancouver, British Columbia | 6.6 | 6.3 | 6.8 | 5.9 | 6.5 | 6.7 |
| Victoria, British Columbia | 3.4 | 4.1 | 5.2 | 3.7 | 4.9 | 4.6 |
| Nanaimo, British Columbia | 6 | 7.3 | 9.7 | 6.3 | 7.2 | 6.5 |
LMIA Processing Over Time: Our Analysis
The number of regions that have been eligible for low-wage LMIA processing has varied over time.
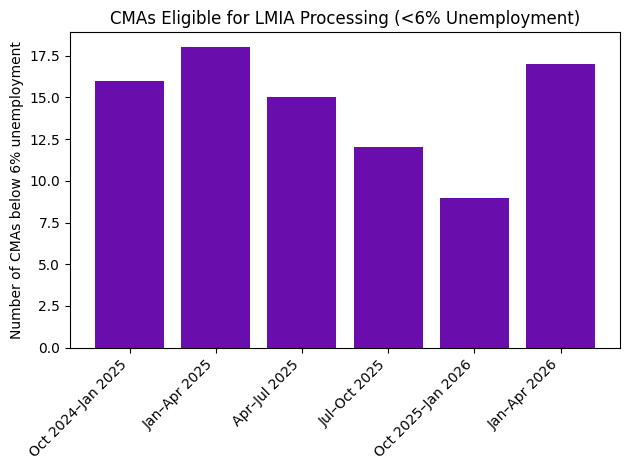
What the graph shows
This graph shows how many regions in which ESDC is processing low-wage LMIAs. Here’s what the data tells us:
- Oct 2024 – Jan 2025: 16 CMAs below 6%
- Jan – Apr 2025: 18 CMAs
- Apr – Jul 2025: 15 CMAs
- Jul – Oct 2025: 12 CMAs
- Oct 2025 – Jan 2026: 9 CMAs (lowest point)
- Jan – Apr 2026: 17 CMAs.
Insights for Newcomers From This Data
Okay, now onto how this data and the trends we’ve identified impact you directly as a temporary worker in Canada. Note that this is only relevant for those workers whose potential pathways forward involve potentially having an employer apply for a low-wage LMIA.
Ontario’s unemployment rates have been persistently higher
There have been several Ontario CMAs where the unemployment rate has never dropped below 6%, since this policy went into effect. This means employers in the following regions have not been able to apply for low-wage LMIAs since the policy change in 2024:
Toronto, Oshawa, Hamilton, St. Catharines–Niagara, Kitchener–Cambridge–Waterloo, Windsor.
The implication for newcomers here is that larger cities in Ontario do not have the best job prospects and may have limited options for getting a low-wage LMIA. It can be a gamechanger to consider smaller regions in Ontario or to look for jobs in other provinces or territories.
Glimmers of hope: the regions with stable low unemployment rates
Only a small set stays below 6% in every single period:
- Saguenay (QC)
- Québec (QC)
- Sherbrooke (QC)
- Thunder Bay (ON)
- Saskatoon (SK)
- Victoria (BC)
Newcomer implication: If your priority is to land somewhere that has repeatedly sat below the 6% line, these CMAs are the most consistently “low-unemployment” options in your dataset. (That does not guarantee job fit—industry mix still matters—but it’s a useful screening signal.)
Volatility is real—especially in smaller CMAs—so treat one period’s spike with caution
Some places swing dramatically between windows, which is typical of smaller labour markets (a relatively small shift in employment can move the rate sharply). Take a look at the swings from the last period alone:
Large drops (improving quickly):
- Windsor: 11.3 → 7.1 (-4.2)
- Nanaimo: 9.7 → 6.3 (-3.4)
- Edmonton: 9.0 → 6.9 (-2.1)
- Toronto: 9.5 → 7.5 (-2.0)
- Kamloops: 8.6 → 6.6 (-2.0)
Large jumps (unemployment increased quickly):
- Belleville–Quinte West: 6.6 → 10.6 (+4.0)
- Kelowna: 6.0 → 8.5 (+2.5)
- Barrie: 7.5 → 8.7 (+1.2)
Newcomer implication: Don’t over-interpret a single jump (up or down), especially in smaller centres. If you are making a relocation decision, consider the data over time not just based on a one-off update.
If you want to stay up-to-date on LMIA processing freezes, and whether those regions have reopened for processing, join our community. We share information multiple times a week covering all things immigration, plus tips for your money, career, and more. You’ll be in good company, with over 170,000 others also getting these updates.
About the author

Stephanie Ford
She/Her
Finance, Law and Immigration Writer
Stephanie is a content creator who writes on legal and personal finance topics, specializing in immigration and legal topics. She earned a Bachelor of Laws and a Diploma in Financial Planning in Australia. Stephanie is now a permanent resident of Canada and a full-time writer at Moving2Canada.
Read more about Stephanie Ford
Citation
Ford, Stephanie.
"LMIA Processing Freeze Ends in 8 Regions Across Canada."
Moving2Canada.
Last modified January 13, 2026.
https://moving2canada.com/news/lmia-processing-freeze-ends-in-8-regions/.
Copy for Citation
Featured Stories

Finances • Jul 23, 2026
Immigrants Start Behind Financially, But Many Catch Up Within a Decade, StatCan Finds
Read more

Express Entry • Jul 23, 2026
Smallest-Ever Express Entry Draw Held for Skilled Military Recruits Category
Read more

IEC • Jul 23, 2026
Best IEC Health Insurance for Canada (2026): Compare UK Providers
Read more

Express Entry • Jul 22, 2026
IRCC Issues 5,000 ITAs in French Express Entry Draw; Crosses 100K Mark for 2026
Read more